NFP November 2025 Report Preview: Nonfarm Payrolls (16 December)
Monday 15 December 2025
Volatility might not be a foreign concept to market watchers and traders alike. It has been part of the broader market from the get-go and is even considered a natural part of the financial sector’s movements. However, in the past few months, volatility has become an increasingly recurring motif for the market, making headlines. Accordingly, in this article, we will dive deeper into what volatility means, what causes it, and we’ll look into the market sectors most affected by it.

TL;DR
An asset is considered volatile if its price moves rapidly (whether upwards or downwards).
Market volatility can be caused by factors such as company news, earnings, politics, economic trends, central bank decisions, and market sentiment.
There are two main types of volatility: implied volatility and historical volatility.
Historical volatility measures the volatility of an asset in the past.
Implied volatility measures how volatile investors expect an asset to be in the future.
While some might think that volatility solely refers to the rapid price drops of a certain financial asset, it, in fact, also describes rapid price rises. In other words, volatility refers to the risk, fear, and uncertainty associated with the potential price fluctuations of a specific financial asset. An asset is, therefore, considered volatile if its value changes rapidly (with quick movements). On the other hand, low volatility occurs when assets rise or drop very slowly, or maintain a stable level over a prolonged period. Volatility is a measure of short-term price fluctuations to assess past price movements and predict future price trends.
There are two types of volatility: historical volatility and implied volatility. Historical volatility, as its name suggests, is based on past performance and is also referred to as statistical volatility as it follows the upward and downward trends of a certain asset by measuring the changes over a preset period of time. Hence, historical volatility measures the volatility of an asset in the past. In contrast, implied volatility measures how volatile investors expect an asset to be in the future and can be calculated from the prices of put and call options.
Volatility can be affected and ignited by a plethora of factors. Below are some of the most common causes behind volatile markets.
The development and movement of the macro, as well as the microeconomic spheres heavily, rely on politics. For example, the effects that the war in Ukraine and the Western sanctions it brought with it on Russian resources took a heavy toll on the market. Various market sectors ranging from Commodities to Forex experienced and still experience high volatility as a result of this political turmoil. For example, Russia is a big provider of Oil (CL), and this commodity’s prices have been extremely volatile over the past few months. Prices of Oil have been surging substantially and have now increased by 23% until the middle of June and might continue to rise if the war persists according to market analysts. Another example of how politics and the economy affect volatility, in times of surging inflation, for example, like that witnessed over the past few months, a general risk-averse mood tends to overtake the market and many market sectors might start losing their luster. For example, over the past month, some Big Tech companies have experienced a downward trend.
Companies that have positive earnings releases, successful product launches, or hype around them tend to be successful and rise in value. Similarly, when a company reports earnings below market estimates or has a bad public representation, a scandal, or a failed product, its stock tends to depreciate. Take, for example, Tesla’s (TSLA) 20% devaluation over the month of May, which was partly due to supply chain issues brought upon by COVID restrictions in Tesla’s factory in Shanghai and also partly due to the fact that investors were worried about Musk’s attention being turned away from Tesla and onto Twitter in light of his Twitter acquisition.
While trend-following might seem harmless in most aspects of life, when it comes to the stock market trading trends can sometimes be harmful. There’s a risk accompanying trend-following in the market as those who tend to trade following their emotions (usually novice traders), can often cause market selloffs or buy-crazes which in turn cause volatility.
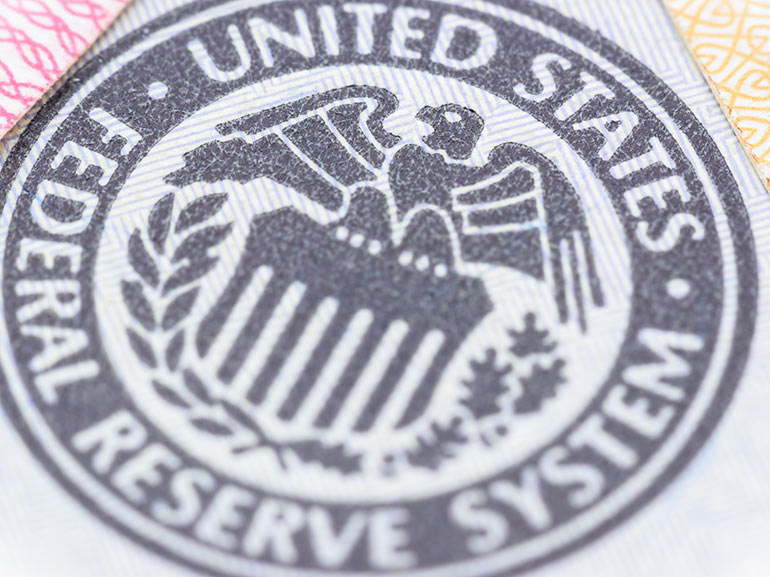
Central banks, like the Federal Reserve and the European Central Bank, can heavily influence trader sentiment and decision-making, which in turn may lead to market volatility. For example, anytime the Fed Reserve's hawkishness increases, fear amongst investors and traders looms, as an aggressive Fed monetary tightening can lead to a recession. For example, high inflation can lead to high interest rates, which can often cause traders to steer away from volatile stocks like tech and opt for “safe-haven” assets like gold.
To conclude, volatility is an inevitable part of the markets, but understanding it, its different types, and what causes it can be crucial to your potential trading, success, however, you should keep in mind that volatility may be a factor of increased risk if markets move in an unfavorable direction.
Moreover, monitoring the factors that can generate market volatility can help you plan and execute your trades more confidently.
*Past performance does not guarantee future results. The above are only projections and should not be taken as investment advice.
Volatility is the state of being unpredictable or susceptible to extreme changes.
In finance, volatility refers to market asset prices that tend to rise or fall rapidly. It can be generated by factors like economic and political changes, stock market news, and central bank decisions.
Historical volatility finds the average deviation of the instrument from its average price.


Learn insights through informative videos, webinars, articles, and guides with our comprehensive Trading Academy.
Discover what’s trending in and outside of Plus500.
This information is written by Plus500 Ltd. The information is provided for general purposes only, and does not take into account any personal circumstances or objectives. Before acting on this material, you should consider whether it is suitable for your particular circumstances and, if necessary, seek professional advice. No representation or warranty is given as to the accuracy or completeness of this information. It does not constitute financial, investment or other advice on which you can rely. Any references to past performance, historical returns, future projections, and statistical forecasts are no guarantee of future returns or future performance. Plus500 will not be held responsible for any use that may be made of this information and for any consequences that may result from such use. Hence, any person acting based on this information does so at their own discretion. The information has not been prepared in accordance with legal requirements designed to promote the independence of investment research.