VIX Index: How to Measure the Volatility Index?
Date Modified: 12/10/2025
While many market instruments and sectors may stumble when faced with uncertainty and fears, the VIX Volatility Index thrives. The CBOE (Chicago Board Options Exchange) Volatility Index, otherwise abbreviated as the VIX, is a benchmark index that has often experienced price swings amidst volatility. While the VIX fell at times, it also soared, hence providing many traders and investors with numerous trading opportunities. Here's what you need to know about the VIX Index.
TL;DR
- The VIX measures expected 30-day volatility of the S&P 500 and is known as the "Fear Index."
- It rises during market uncertainty, geopolitical events, economic shifts, and financial crises.
- The VIX usually moves inversely to the S&P 500. When stocks fall, the VIX climbs.
- VIX above 30 signals high fear and volatility; below 20 indicates market stability and low fear.
- Significant VIX spikes occurred during events like the 1987 crash, the 2008 financial crisis, and the 2020 pandemic.
- Traders use VIX ETFs, futures, or CFDs for hedging, speculation, and diversification.
- Going long the VIX means betting on rising volatility; going short means betting on declining volatility.
- The VIX is a useful but imperfect indicator and should be used alongside other market analysis tools.
Understanding the VIX Index: What Is the VIX and What Does the VIX Measure?
The CBOE Volatility Index, or the VIX, is a real-time index used to estimate S&P 500 relative strength based on market expectations. In other words, this index measures the implied US market's volatility in the upcoming 30 days based on investors' and traders' sentiments.
Accordingly, it reflects how the majority of market participants think the S&P 500, which includes the biggest publicly traded companies in the US, will fare over the course of the upcoming 30 days.
Moreover, the VIX index, which uses the S&P 500 index as a benchmark for overall market sentiment, is often called the "Fear Index" since it also highlights investor apprehension.
Calculating the VIX: VIX Formula
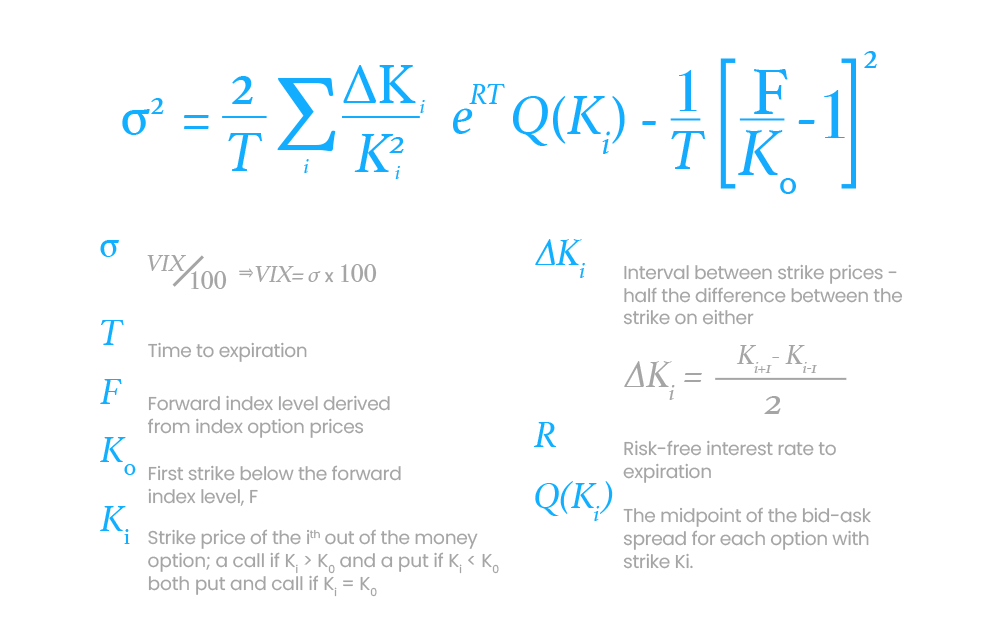
The S&P 500 Options are averaged and weighted to calculate the VIX during each trading day. However, since calculating the VIX can be daunting to some, here's an illustrated formula to help explain it:
What Affects VIX Prices?
Market Uncertainty and Investor Sentiment
The VIX tends to rise during periods of elevated market uncertainty or anxiety. Shifts in investor sentiment triggered by worries about economic slowdowns, geopolitical instability, or unexpected developments can lead to sharp spikes in the VIX.
Geopolitical Events and Economic Data
Major events such as wars, elections, or significant policy shifts can introduce uncertainty, driving up the VIX. Likewise, key economic indicators, including GDP growth, inflation figures, unemployment rates, and Non-Farm Payroll reports, can influence market expectations and volatility, thus affecting the VIX.
Financial Crises and Market Turmoil
In times of financial distress or major market downturns, the VIX typically surges as investors rush to hedge their portfolios, increasing demand for protective options.
Impact of Market Structure and Investment Products
Changes in market structure, such as the growth of call-overwriting ETFs or other derivatives strategies, can influence option pricing and supply. These shifts can, in turn, affect the calculation and behaviour of the VIX.
Inverse Correlation with the S&P 500
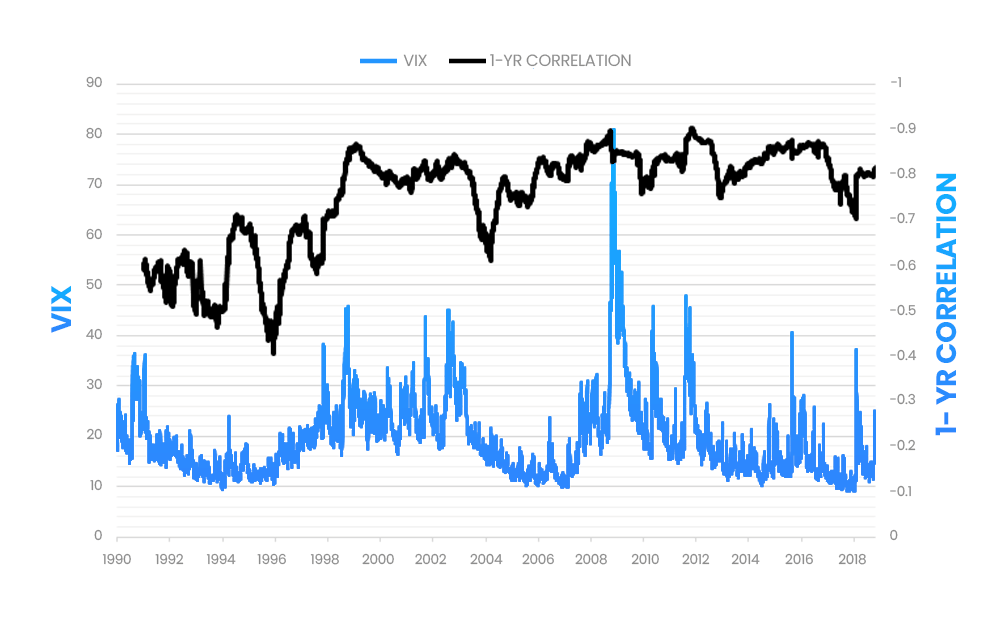
There is generally an inverse relationship between the VIX and the S&P 500. When stock prices fall, volatility rises, causing the VIX to increase. Conversely, when markets rally, the VIX usually declines.
This is why, when traders know that an S&P 500 company may be trading down due to volatility, they can trade the VIX if they believe that this volatility will increase in the future in order to balance it out.
How to Read the VIX Index: What Is a Good VIX?
As a rule of thumb, traders should know that there is a correlative relationship between fear levels and VIX levels. As such, higher market fear and volatility mean higher VIX levels. Along the same line, anything over 30 indicates great uncertainty.
As for what a good VIX measurement is, VIX values below 20 indicate a more stable and less volatile market atmosphere.
VIX Records: Market Volatility Timeline
- 1929: During the Wall Street crash of 1929, the volatility reached 127% as the Dow Jones Industrial Average experienced a loss of over 24% over two consecutive days.
- 1980: The VIX soared over 240% as Silver prices spiked due to a surge in inflation which drove safe havens such as precious metals upwards.
- 1987: During the Black Monday stock market crash which was mainly driven by program trading, a drop of over 20% in Wall Street indices caused a 130% rise in volatility.
- 2008-2009: Reckless banking practices drove the VIX over 80 in what is known as 'the Great Financial Crisis' as the S&P 500 lost over 27%.
- 2015: The Swiss National Bank (SNB), which is the Central Bank of Switzerland, lifted the interest rate floor and discontinued its exchange rate ceiling which led to a collapse in the Forex market as the EUR/CHF dropped, causing the VIX index to gain about 100%.
- 2016: Brexit took place causing the GBP/USD to deteriorate and volatility to reach over 46% over the course of two weeks.
- 2022: As the war between Ukraine and Russia started in February, recession fears, high inflation, interest rate hikes, and the COVID-19 pandemic took a toll on market sentiment, the VIX soared by 70% up till the middle of October whereby it reached levels above 30 to later level out in the final 2 months of the year.
- 2025: The outbreak of hostilities between Israel and Iran in June 2025 triggered a sharp uptick in market volatility, as reflected by a rise in the VIX. The index climbed from around 18 to over 21--22 in the immediate aftermath. Some accounts cited intraday spikes reaching as high as 38.6 in specific trading sessions or platforms, though this higher reading was not consistently verified across major exchanges. Most widely accepted reports placed the VIX in the low 20s during the period, with the index holding slightly above 20 as the conflict persisted. While the spike signalled increased investor anxiety, the market reaction was relatively restrained compared to responses seen during past major geopolitical crises.
*Past performance does not reflect future results
How to Interpret the VIX Index: Is a High VIX Bullish or Bearish?
Extremely high VIX levels may indicate a bearish market sentiment with extremely high volatility. On the flip side, since the VIX looks forward, low levels may indicate a potentially bullish market ahead. Nonetheless, there's no one-size-fits-all solution, and there's no guarantee that the VIX will indeed lead to bullishness or bearishness in the markets.
Why Is the VIX Important?
The VIX is considered by many to be an important index for investors and options traders alike since it provides them with a sense of the anticipated volatility. Since volatility has a substantial role in determining options prices, the VIX may have a direct effect on the market as a whole.
What Happens When the VIX Spikes?
Stocks can indicate a positive reversal when VIX spikes more than 20% above their 10-day moving average line, according to an Investment Banking Division's (IBD) study.
Take, for example, the all-time high the VIX achieved in 2020 as the CORONAVIRUS pandemic crushed many market sectors and increased fears and volatility. Accordingly, on 18 March 2020, the VIX topped out at 85.47, one point away from its peak price during the financial crisis of 2007-2008 at 89.53.
At that time, many market selloffs materialised which only highlighted the intense fears market participants had then amidst the uncertainty arising from the novel virus strain.
What Does It Mean When the VIX Is Up or Down?
When the VIX is down, there is less market anxiety, more stability, and longer-term growth. When the VIX is dropping, the S&P 500 tends to trade up. Along the same lines, when the VIX goes up, the S&P 500 generally tends to trade down, and the market becomes more volatile. Traders should keep in mind that volatility does not always entail a weak market, as markets can trade down while volatility remains low.
How to Trade the CBOE VIX
Trading the CBOE VIX index can be done through Plus500's VIX Volatility Index (VIX) CFDs, which are agreements between two parties stipulating that the difference between the open and closing prices of the VIX must be paid. CFDs allow traders to trade the VIX without actually owning an interest in it. This means that traders can trade on rising or falling VIX prices depending on their position. Traders and investors often use VIX-linked instruments for diversification and hedging, as well as for pure speculation, due to their strong negative correlation with the stock market.
You can learn more about CFD trading in our "What Is CFD Trading" article and video.
Other ways to trade the VIX include VIX Exchange Traded Funds (ETFs) and VIX Futures contracts.
Going Short VS. Going Long the VIX
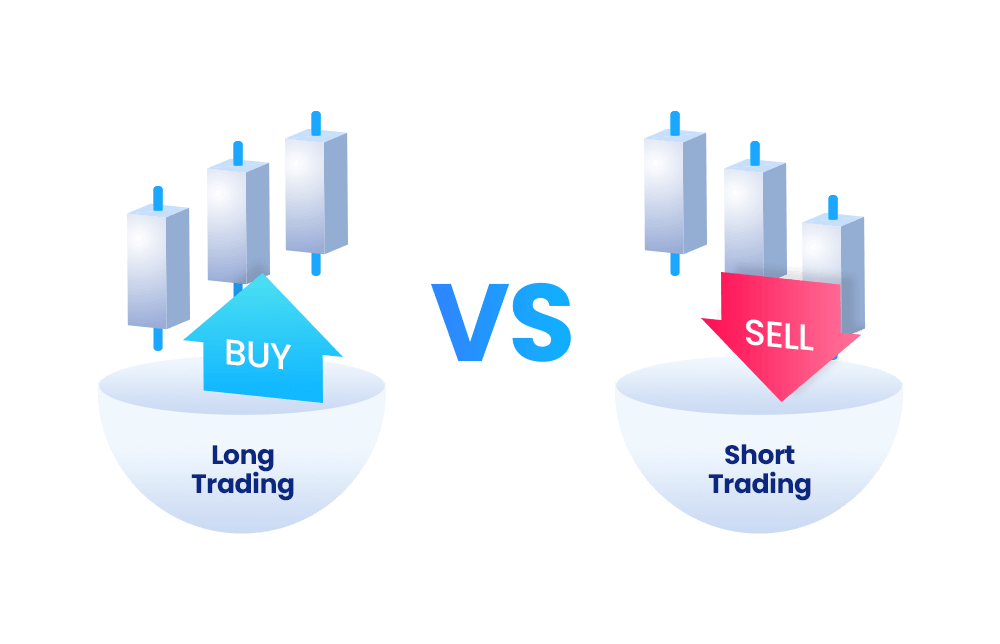
While there's no black-or-white formula to trading the VIX, generally speaking, traders may go short (open a sell position) on the VIX when it is expected that the S&P 500's price may rise.
On the flip side, they may open a long position (open a buy position) when they believe that S&P 500 prices may fall.
What Moves the S&P 500 Prices?
As mentioned above, the VIX and the S&P 500 are negatively correlated. As such, knowing what can move the prices of the S&P 500 can help traders and investors anticipate potential VIX values. Some of the factors that can shift the value of the S&P 500 include the value of the companies weighed in the index, political changes, and market sentiment.
You can read more about the factors that shift index prices in our article titled "What Moves an Index's Price."
Conclusion
The VIX index is indeed a crucial gauge when it comes to the market and the overall sentiment. However, like many market instruments, the VIX also has its pros and cons, and there are those who believe that it might not be the best market sentiment index. Despite this, it is still one of the indices most referred to when trying to measure volatility. Traders may trade the VIX with Plus500 VIX CFDs, which allows them to potentially benefit from rising or falling VIX prices depending on their position without having actual ownership of the index. Nonetheless, traders should keep in mind that they can also incur losses if the price of the VIX goes against their position.
FAQs
The VIX Index is an index that measures the expectations of volatility in the US market over the next 30 days.
The VIX Index chart shows the price swings in the VIX Index, allowing us to track market expectations of volatility over the next 30 days.
The VIX Index can be traded through VIX ETFs, VIX Futures, or VIX CFDs on the Plus500 platform.
Related News & Market Insights
Get more from Plus500
Expand your knowledge
Learn insights through informative videos, webinars, articles, and guides with our comprehensive Trading Academy.
Explore our +Insights
Discover what’s trending in and outside of Plus500.
Stay up-to-date
Never miss a beat with the latest News & Markets Insights on major market events.
